[SPONSORED GUEST ARTICLE] In HPC, leveraging compute resources to the maximum is a constant goal and a constant source of pressure. The higher the usage rate, the more jobs get done, the less resources sit idle, the greater the return on the HPC investment. At Lenovo, with its….
NVIDIA at SIGGRAPH: DGX Integration with Hugging Face for LLM Training; Announcement of AI Workbench
August 8, 2023 by

At the the SIGGRAPH conference this morning in Los Angeles, NVIDIA made several generative AI-related announcements, including a partnership with Hugging Face intended to broaden access to generative AI supercomputing (NVIDIA’s DGX cloud hardware) for developers building large language models (LLMs) and other AI applications on the Hugging Face platform. The companies said the combination […]
ExaWorks: Tested Component for HPC Workflows
July 27, 2023 by
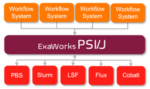
ExaWorks is an Exascale Computing Project (ECP)–funded project that provides access to hardened and tested workflow components through a software development kit (SDK). Developers use this SDK and associated APIs to build and deploy production-grade, exascale-capable workflows on US Department of Energy (DOE) and other computers. The prestigious Gordon Bell Prize competition highlighted the success of the ExaWorks SDK when the Gordewinner and two of three finalists in the 2020 Association for Computing Machinery (ACM) Gordon Bell Special Prize for High Performance Computing–Based COVID-19 Research competition leveraged ExaWorks technologies.
@HPCpodcast: HPC Software Rock Star Sunita Chandrasekaran on Exascale Programming and the Emergence of the RSE
June 14, 2023 by

In this episode of the @HPCpodcast, sponsored by Lenovo, Shahin and Doug talk with University of Delaware’s Sunita Chandrasekaran, a rock star in the world of supercomputing software. Chandrasekaran is Associate Professor at the Department of Computer Information Systems and co-directing the AI Center of Excellence at the university.
Sylabs Unveils ‘Singularity Containers 101’ Curriculum for Colleges
June 14, 2023 by
Reno, NV – June 14, 2022 – Sylabs, provider of tools and services for performance-intensive container technology, today announces the “Singularity Containers 101” curriculum. Using the open-source SingularityCE platform, this curriculum is designed for college programs, offering instruction in container technology. This program is built to prepare students to navigate and lead in the next […]
Exxact Partners Offers Run:ai for GPU Clusters in AI Workloads
November 30, 2022 by
FREMONT, CA — Nov. 30, 2022 — Exxact Corporation, a provider of high-performance computing (HPC), artificial intelligence (AI), and data center solutions, now offers Run:ai in their solutions. This groundbreaking Kubernetes-based orchestration tool incorporates an AI-dedicated, high-performant super-scheduler tailored for managing GPU resources in AI clusters. Run:ai dynamically optimizes hardware utilization for AI workloads, enabling clusters […]
Relief for the Solution Architect: Pushing Back on HPC Cluster Complexity with Warewulf and Apptainer
November 23, 2022 by

[SPONSORED CONTENT] How did you, at heart and by training a research scientist, financial analyst or product design engineer doing multi-physics CAE, how did you end up as a… systems administrator? You set out to be one thing and became something else entirely. You finished school and began working with some hefty HPC-class clusters. One […]
Rocky Enterprise Software Foundation Approves Bylaws and Charter for Open Community Control of Rocky Linux and Projects
November 10, 2022 by
RENO, Nev.—November 10, 2022—The Rocky Enterprise Software Foundation (RESF) today published its charter and bylaws, documenting the organization’s governing structure and rules for hosting open source projects, including its namesake project, Rocky Linux. The charter and bylaws also describe the RESF vision to create and nurture a community of individuals and organizations that are committed […]
Staying at the Cutting Edge of Automotive Design Technology with Azure Cloud Platform and AMD
October 20, 2022 by

[SPONSORED CONTENT] In automotive, first movers have a massive advantage. Success in the industry centers on vehicle R&D, at the core of which is design, performance and crash safety multi-physics software. Generating remarkably true-to-life simulations, these applications quicken vehicle time-to-market, allowing engineers to sample more design options and conduct more virtual tests in less time. […]
A Look Inside the AMD-HPE Blade that Drives Frontier, the World’s First Exascale Supercomputer
October 18, 2022 by

[SPONSORED CONTENT] The new number 1 supercomputer in the world, the AMD-powered and HPE-built Frontier, is celebrated today, Exascale Day, as the world’s first exascale (a billion billion calculations per second) HPC system. Recognized at last spring’s ISC conference in Hamburg for having exceeded the exascale barrier, a display of the Frontier blade in HPE’s ISC booth was a focus of attention on the conference floor. We thought it would be interesting to sit down with two senior officials from AMD and HPE to talk about the Frontier blade, what’s in it, its design innovations and the anticipated, long-term impacts of the blade on leadership supercomputing and on systems used by the broader HPC industry.