With help from DOE supercomputers, a USC-led team expands models of the fault system beneath its feet, aiming to predict its outbursts. For their 2020 INCITE work, SCEC scientists and programmers will have access to 500,000 node hours on Argonne’s Theta supercomputer, delivering as much as 11.69 petaflops. “The team is using Theta “mostly for dynamic earthquake ruptures,” Goulet says. “That is using physics-based models to simulate and understand details of the earthquake as it ruptures along a fault, including how the rupture speed and the stress along the fault plane changes.”
Altair Inspire update accelerates simulation-driven design
April 23, 2020 by

Today Altair updated Altair Inspire, the company’s fully-integrated generative design and simulation solution that accelerates the creation, optimization, and study of innovative, structurally efficient parts and assemblies. The latest release offers an even more powerful and accessible working environment, enabling a simulation-driven design approach that will cut time-to-market, reduce development costs, and optimize product performance. “Inspire enables both simulation analysts and designers to perform ‘what-if’ studies faster, easier, and earlier, encouraging collaboration and reducing product time to market.”
Codeplay implements MKL-BLAS for NVIDIA GPUs using SYCL and DPC++
April 23, 2020 by

In this special guest feature, Rod Burns from Codeplay writes that the company has made significant contributions to enabling an open standard, cross-architecture interface for developers as part of the oneAPI industry initiative. Software developers are looking more than ever at how they can accelerate their applications without having to write optimized processor specific code. […]
Arm-Powered Fujitsu Supercomputer to fuel Aerospace Research at JAXA in Japan
April 22, 2020 by
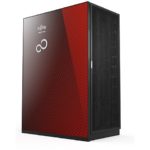
Today Fujitsu announced that it has received an order for a supercomputer system from the Japan Aerospace Exploration Agency (JAXA). Powered by the Arm-based A64FX processor, the system will contribute in improving the international competitiveness of aerospace research, as it will be widely used as the basis for JAXA’s high performance computing. “Scheduled to start operation in October 2020, the new computing system for large-scale numerical simulation, composed of Fujitsu Supercomputer PRIMEHPC FX1000, is expected to have a theoretical computational performance of 19.4 petaflops, which is approximately 5.5 times that of the current system.”
NSF awards compute time on Frontera Supercomputer for 49 projects
April 18, 2020 by

The most powerful supercomputer in the world for academic research has established its mission for the coming year. “The NSF has approved allocations of supercomputing time on Frontera to 49 science projects for 2020-2021. Time on the TACC supercomputer is awarded based on a project’s need for very large scale computing to make science and engineering discoveries, and the ability to efficiently use a supercomputer on the scale of Frontera.”
Project BreathEasy using Digital Twins of Lungs to Improve COVID-19 Patient Outcomes
April 14, 2020 by
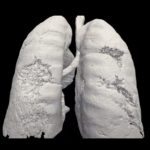
OnScale and LEXMA have partnered to create patient-specific digital twins that may accurately predict oxygen and blood flow in a patient’s lungs, helping doctors make critical decisions about ventilator and intubation requirements for COVID-19 patients. Each digital twin is patient-specific and built from a combination of medical images (for example from CT scans and X-rays) and thousands of simulations of lung airflow and blood flow using the LEXMA Moebius fluid dynamics solver running on OnScale’s Cloud Simulation platform.
Supercomputing Ocean Wave Energy
April 14, 2020 by
Researchers are using XSEDE supercomputers to help develop ocean waves into a sustainable energy source. “We primarily used our simulation techniques to investigate inertial sea wave energy converters, which are renewable energy devices developed by our collaborators at the Polytechnic University of Turin that convert wave energy from large bodies of water into electrical energy,” explained study co-author Amneet Pal Bhalla from SDSU.
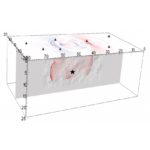
Supercomputing the spread of the coronavirus in busy indoor spaces
April 11, 2020 by

A joint project carried out by four Finnish research organisations has studied the transport and spread of coronavirus through the air. Preliminary results indicate that aerosol particles carrying the virus can remain in the air longer than was originally thought, so it is important to avoid busy public indoor spaces. This also reduces the risk of droplet infection, which remains the main path of transmission for coronavirus.
Intel Commits $50 Million to Pandemic Response Technology Initiative
April 7, 2020 by

Today, Intel pledged an additional $50 million in a pandemic response technology initiative to combat the coronavirus through accelerating access to technology at the point of patient care, speeding scientific research and ensuring access to online learning for students. Included in Intel’s effort is an additional innovation fund for requests where access to Intel expertise and resources can have immediate impact. “We hope that by sharing our expertise, resources and technology, we can help to accelerate work that saves lives and expands access to critical services around the world during this challenging time.”
Jülich Supercomputers Power New Insights into Brain Imaging
April 6, 2020 by
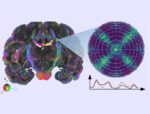
Researchers are using biophysical modeling and simulations on Jülich supercomputers to develop new brain tissue imaging methods. “When generating a detailed network model of the brain, nerve fiber crossings pose a major challenge for current neuroimaging techniques. Scientists at Forschungszentrum Jülich have now found that scattered light can be used to resolve the brain’s substructure like the crossing angles of the nerve fibers with micrometer resolution. For their studies, the researchers combined microscopy measurements and simulations on supercomputers.”