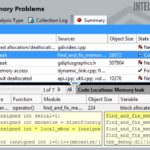
Intel Inspector is an integrated debugger that can easily diagnose latent and intermittent errors and guide users to locate the root cause. It does this by instrumenting the binaries, including dynamically generated or linked libraries, even when the source code is not available. This includes C, C++, and legacy Fortran codes.
Use Intel® Inspector to Diagnose Hidden Memory and Threading Errors in Parallel Code
December 28, 2017 by
Speed Your Application with Threading Building Blocks
December 22, 2016 by

With modern processors that contain a large number of cores, to get maximum performance it is necessary to structure an application to use as many cores as possible. Explicitly developing a program to do this can take a significant amount of effort. It is important to understand the science and algorithms behind the application, and then use whatever programming techniques that are available. “Intel Threaded Building Blocks (TBB) can help tremendously in the effort to achieve very high performance for the application.”
Modernizing Code with the Intel Vectorization Advisor
March 17, 2016 by
Threading plus vectorization together can increase the performance of an application more than one technique or the other. Threading and vectorizing an application are two techniques that are known to increase the performance of an application using modern CPUs and coprocessors. However, a deep understanding of the application is needed in order to make the decisions needed and to rewrite portions of the application to take advantage of these techniques. In cases where the developer might not be familiar with the code an automated tools such as the Intel Vectorization Advisor can assist the developer.