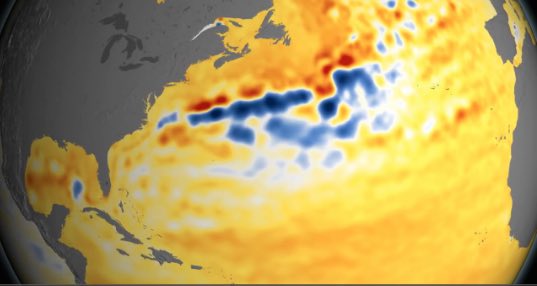

NASA visualization shows shifts in the Gulf Stream (in Blue). Yellow shows drops in Sea Levels while Orange shows increases.
In this video, Josh Willis from the Jet Propulsion Laboratory describes the Agency’s latest sea level research and new visualizations of global sea level changes. Seas around the world have risen an average of nearly 3 inches since 1992, with some locations rising more than 9 inches due to natural variation, according to the latest satellite measurements from NASA and its partners. An intensive research effort now underway, aided by NASA observations and analysis, points to an unavoidable rise of several feet in the future.
Sea level rise is one of the most visible signatures of our changing climate, and rising seas have profound impacts on our nation, our economy and all of humanity,” said Michael Freilich, director of NASA’s Earth Science Division. “By combining space-borne direct measurements of sea level with a host of other measurements from satellites and sensors in the oceans themselves, NASA scientists are not only tracking changes in ocean heights but are also determining the reasons for those changes.”
As Earth’s oceans continue to warm, and its ice sheets continue to show signs of accelerated change, NASA is pursuing answers to how quickly seas could rise in the future. Scientists worldwide use NASA data to tackle some of the toughest questions about how our planet is changing. Using the vantage point of space, NASA is pioneering research into how changes in the ocean, ice sheets, glaciers and Earth’s surface combine to produce global changes in sea level.
The question scientists are grappling with is how quickly will seas rise?
Given what we know now about how the ocean expands as it warms and how ice sheets and glaciers are adding water to the seas, it’s pretty certain we are locked into at least 3 feet of sea level rise, and probably more,” said Steve Nerem of the University of Colorado, Boulder, and lead of the Sea Level Change Team. “But we don’t know whether it will happen within a century or somewhat longer.”
In 2013, the United Nations Intergovernmental Panel on Climate Change (IPCC) issued an assessment based on a consensus of international researchers that stated global sea levels would likely rise from 1 to 3 feet by the end of the century. According to Nerem, new research available since this report suggests the higher end of that range is more likely, and the question remains how that range might shift upward.
The data reveal the height of the sea surface is not rising uniformly everywhere. Regional differences in sea level rise are dominated by the effects of ocean currents and natural cycles such as the Pacific Decadal Oscillation (PDO). But, as these natural cycles wax and wane, they can have major impacts on local coastlines.
Sea level along the west coast of the United States has actually fallen over the past 20 years because long-term natural cycles there are hiding the impact of global warming,” said Josh Willis, an oceanographer at NASA’s Jet Propulsion Laboratory (JPL) in Pasadena, California. “However, there are signs this pattern is changing. We can expect accelerated rates of sea level rise along this coast over the next decade as the region recovers from its temporary sea level ‘deficit.’”
Scientists estimate that about one-third of sea level rise is caused by expansion of warmer ocean water, one-third is due to ice loss from the massive Greenland and Antarctic ice sheets, and the remaining third results from melting mountain glaciers. But, the fate of the polar ice sheets could change that ratio and produce more rapid increases in the coming decades.
The Greenland ice sheet, covering 660,000 square miles — nearly the area of Alaska — shed an average of 303 gigatons of ice a year over the past decade, according to satellite measurements. The Antarctic ice sheet, covering 5.4 million square miles –larger than the United States and India combined — has lost an average of 118 gigatons a year.
We’ve seen from the paleoclimate record that sea level rise of as much as 10 feet in a century or two is possible, if the ice sheets fall apart rapidly,” said Tom Wagner, the cryosphere program scientist at NASA Headquarters in Washington. “We’re seeing evidence that the ice sheets are waking up, but we need to understand them better before we can say we’re in a new era of rapid ice loss.”
Although Antarctica’s contribution to sea level rise currently is much smaller than that of Greenland, recent research indicates this could change in the upcoming century. In 2014, two West Antarctica studies focused on the acceleration of the glaciers in the Amundsen Sea sector showed its collapse is underway.
East Antarctica’s massive ice sheet remains the primary unknown in sea level rise projections. Though it appears to be stable, a recent study found under a major glacier two deep troughs that could draw warm ocean water to the base of the glacier, causing it to melt.
The prevailing view among specialists has been that East Antarctica is stable, but we don’t really know,” said glaciologist Eric Rignot of the University of California Irvine and JPL. “Some of the signs we see in the satellite data right now are red flags that these glaciers might not be as stable as we once thought. There’s always a lot of attention on the changes we see now, but as scientists our priority needs to be on what the changes could be tomorrow.”
One of the keys to understanding future rates of ice loss is determining the role ocean currents and ocean temperatures play in melting the ice sheets from below its edges. A new six-year NASA field campaign took to the waters around Greenland this summer to probe how warming ocean waters are triggering Greenland glacier degradation. The Oceans Melting Greenland (OMG) project is taking coastal ocean temperature measurements, observing glacial thinning at the ice’s edge, and producing the first high-resolution maps of the seafloor, fjords and canyons in the continental shelf surrounding Greenland.
NASA uses the vantage point of space to increase our understanding of our home planet, improve lives, and safeguard our future. NASA develops new ways to observe and study Earth’s interconnected natural systems with long-term data records. The agency freely shares this unique knowledge and works with institutions around the world to gain new insights into how our planet is changing.
Josh Willis is the Project Scientist the Jason-3 Mission. Set to launch later this year, Jason-3 is the newest satellite in a series designed to maintain long-term satellite altimetry observations of global sea surface height. These data provide critical ocean information that forecasters need to predict devastating hurricanes and severe weather before they arrive onshore. Over the long term, Jason-3 will help us to track global sea level rise, an increasing threat to the resilience of coastal communities and to the health of our environment.