 Through profiling, developers and users can get ideas on where an application’s hotspots are, in order to optimize certain sections of the code. In addition to locating where time is spent within an application, profiling tools can locate where there is little or no parallelism and a number of other factors that may affect performance. Performance tuning can help tremendously in many cases.
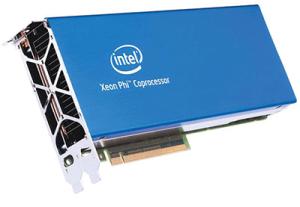
An example that can be investigated to demonstrate the use of profiling to speed up performance is a simple matrix transpose. From the size of the matrix, the memory bandwidth for this small but useful application can be measured, in terms of GB/sec. Various types of profiling and optimization can lead to faster (higher GB/sec) results. Initial results for the application, running in serial on a workstation processor was 4.3 GB/sec and using an Intel Xeon Phi 3120A coprocessor was only 0.7 GB/sec. The host contained 2 Intel Xeon E5-2630 v2 processors.
By using the Intel VTune Amplifier XE, more information can be collected as to the bottlenecks in this matrix transpose code. The analysis shows that the main issue is that the application runs in serial mode. The first step in optimization is to use OpenMP to spread the work among processors. Performance for just the host implementation improved to 28.6 GB/sec and for the Intel Xeon Phi coprocessor version to 20.0 GB/sec. Once the application has been parallelized, more information can be obtained from VTune. From the analysis, it was observed that a significant amount of time was spent in idle mode. A general exploration of the application can be done to investigate the hardware metrics.
A further use of VTune is to actually investigate line by line, and even assembly instructions to see where the bottlenecks may be. Event counts for every line of code or assembly can be looked at. While investigating and then making adjustments in the code itself through parallelism and tiling, the performance of a matrix transposition can be greatly improved. Performance of this real world application achieved over 70 % of the STREAM benchmark on the CPUs on the host and over 70 % of the theoretical peak performance of the Intel Xeon Phi coprocessor.
Source: Colfax International, USA
Transform data into opportunity. Speed data analysis in your applications. Intel® Parallel Studio XE


