In this video, NASA researchers simulate ocean currents for better understanding of planetary weather systems.
Scientists are trying a new, interactive way to understand ocean current data with the help of high-resolution global ocean simulations. In the part of the global visualization shown, the Loop Current, the origin of the Gulf Stream, features prominently. Surface water speeds are shown ranging from 0 meters per second (dark blue) to 1.25 meters per second (cyan). The video is running at one simulation day per second.
A team from the NASA Advanced Supercomputing (NAS) facility, at Ames Research Center in Silicon Valley, has developed a new visualization tool that is being used by researchers from the Estimating the Circulation and Climate of the Ocean (ECCO) project to study the behavior of ocean currents. The new visualization tool provides high-resolution views of the entire globe at once, allowing the scientists to see new details that they had missed in previous analyses of their simulation, which was run on NASA’s Pleiades supercomputer.
The visualization is shown on a 10 by 23-foot, 128-screen hyperwall at the NAS facility. By switching the hyperwall view from one global image to displays of single regions, properties such as temperature, surface wind stress, density, and salinity can be clearly identified with high-contrast colors that can be changed instantly.
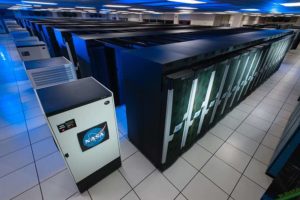
Pleiades Supercomputer
Pleiades and the high-capacity network bandwidth and data processing capabilities of the hyperwall is one of the most powerful visualization systems in the world, and ECCO scientists use it to discover new ocean features and their effect on the larger ocean system.
The visualization project is a collaboration between NASA’s Ames Research Center in Silicon Valley, NASA’s Jet Propulsion Laboratory in Pasadena, and the Massachusetts Institute of Technology in Boston.