
This sponsored post takes a look at Intel’s tools, like Intel VTune Amplifier, for improving application performance on the latest processors.
There are many tools out there that will analyze an application’s performance. They can show you a lot of information, with colorful graphics, but with little insight into what it all means and what you can do about it.
These days, to squeeze the most out of the latest HPC hardware for compute-intensive applications now requires programmers to think about increasing loop vectorization, reducing memory latency, ensuring effective use of multicore processors, and much more. Just running a production application on the latest processors doesn’t guarantee good, if not best, performance. Getting to where you are enjoying the full speedups provided by the latest hardware will involve making critical modifications to the code.
But where? And what modifications?
Tuning code has, for a long time, been an art. Knowing what to look for and how to correct inefficiencies in serious numerical computations has not been easy for most programmers. It’s often hard to even know which tool to start with. Which is why the Intel® VTune™ Amplifier Application Performance Snapshot could prove to be a great way to get an instant summary of an application’s performance characteristics and issues.
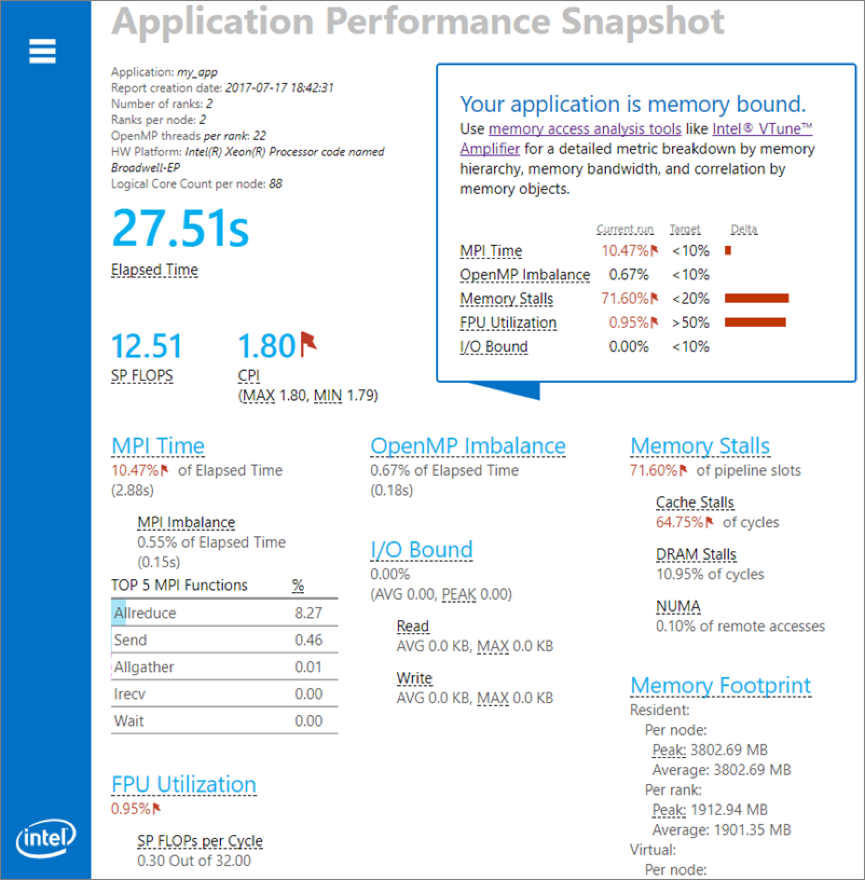
Sample APS report that appears in a Web browser. Here APS has recognized that the application is memory bound and suggests the VTune memory access tools to use for further analysis. (Image Source: Intel)
The Application Performance Snapshot analyzes a shared memory or MPI application’s use of available hardware (CPU, FPU and Memory), along with time spent in MPI, MPI and OpenMP imbalances, memory access efficiency, FPU usage, and I/O and memory footprint. And, it suggests some basic ways to enhance performance on Intel platforms. This first step in application performance analysis gives you an initial idea of some key optimization areas to look at and suggests the appropriate profiling tools in Intel® Parallel Studio XE to use for performance tuning.
The next steps for shared memory programs might be to use another performance analysis tool for more detailed information, such as Intel VTune Amplifier or Intel® Advisor.
For an MPI application, next steps could include communication tuning with the mpitune utility or using another performance analysis tool, such as Intel Trace Analyzer and Collector or Intel VTune Amplifier, to gain more insight.
Intel VTune Amplifier Application Performance Snapshot collects and displays a number of critical metrics to give you an immediate and comprehensive view of how your application performs on Intel systems. Metrics gathered include:
- Elapsed Time: Execution time of specified application in seconds.
- SP GFLOPS: Number of single precision giga-floating point operations calculated per second.
- Cycles per Instruction Retired (CPI): The amount of time each executed instruction took measured by cycles. The CPI value can give an indication that of long-latency memory and other inefficiencies.
- MPI Time: Average time per process spent in MPI calls. High values could indicate a sub-optimal use of the MPI library.
- MPI Imbalance: CPU time spent by ranks spinning in waits on communication operations. A high value could indicate an application workload imbalance between ranks, or non-optimal communication.
- OpenMP Imbalance: Percentage of elapsed time that your application wastes at OpenMP synchronization barriers because of load imbalances.
- CPU Utilization: Estimate of the utilization of all logical CPU cores on the system by your application. This metric indicates the parallel efficiency of your application – are you keeping all available cores busy?
- Memory Stalls: Indicates how memory subsystem issues affect application performance and if your application is memory bound.
- FPU Utilization: The effective FPU usage while the application was running and gives a measure of the vector efficiency of your application.
- I/O Operations: The time spent by an MPI application while reading data from the disk or writing data to the disk.
- Memory Footprint: Average per-rank and per-node consumption of both virtual and resident memory.
As you make modifications to your code, use Intel VTune Amplifier APS to quickly check your optimization progress and to identify further tuning opportunities.
Intel VTune Amplifier is available as part of the Intel Parallel Studio XE Professional and Cluster Editions, and as a stand-alone product.
Get a Free 30-day Trial Today.