Sponsored Post
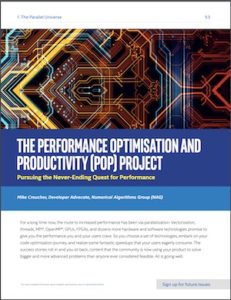
As most in the HPC industry have known for years now, the primary route to increased performance has been parallelization. That’s according to a new edition of Parallel Universe Magazine, from Intel.

Download the full magazine.
Vectorization, threads, MPI, OpenMP, GPUs, FPGAs, and many more hardware and software solutions are at your disposal.
“So you choose a set of technologies, embark on your code optimization journey, and realize some fantastic speedups that your users eagerly consume,” Intel says.
But, the “quest” for improved performance is never over, if you want to remain competitive in your respective market. Your end users will undoubtedly call for more speed in the future, and the models your clients are building are likely bigger and more complex than ever.
A chapter in the latest Parallel Universe Magazine issue asks the following question: Where do you start applying your development efforts?
Enter the Performance Optimization and Productivity project — also known as the PoP project. According to Intel, the project is a European Union-funded, international group of partners working to improve parallel software via several complementary routes.
These include:
- Developing a general methodology that can be used to understand parallel performance
- Developing open source tools that can be used to apply the PoP methodology
- Creating a set of detailed case studies where PoP experts demonstrate these developments by auditing and refactoring the code of academic and industrial clients (available for free for clients within the EU)
Intel points out the PoP methodology can be applied to a range of parallelization schemes and programming languages, including OpenMP and MPI in Fortran*, C, and C++, a well as applications written in MATLAB*, Python*, and Perl*, among others.
The PoP offers a portfolio of services designed to help users optimize parallel software and understand performance issues. The services are free of charge to academic, research, or commercial organizations in the EU.
So, what’s different about the POP project? Traditionally, there are several things companies can gather intelligence about their applications, including scaling experiments, profiling, and tracing using products like Intel VTune Amplifier or the open source tools developed by some PoP partners.
These can result in a huge amount of data to sift through, containing everything from instruction counters to cache misses. It can be difficult to move from this sea of information to the kind of insights that would really help a code developer determine the most appropriate direction to follow to improve the code,” Intel points out.
The PoP methodology works to distill this “sea of data” into a small hierarchy of metrics that measure the relative impact of the different factors inherent in parallelization. Each metric is a measure of efficiency between 0 and 1, where higher numbers are better, the magazine explains. PoP considers anything below 0.8 as worthy of further attention.
The magazine explores a PoP case study in detail to illustrate this methodology and results. One of the PoP partners, The Numerical Algorithms Group (NAG), recently worked on the commercial computational fluid dynamics solver zCFD, developed by Zenotech. According to the report, by generating the PoP metrics from Intel VTune Amplifier data and collaborating with the original developers, NAG helped improve the runtime of one particular simulation by three times.
The chapter on the Performance Optimization and Productivity Project in the recent magazine issue explores in detail the following topics:
- The PoP Project
- The PoP Methodology
- The PoP Metrics and zCFD
- Parallel Efficiency
- Computational Efficiency
Download the new issue of Parallel Universe Magazine for more on the latest in HPC from Intel.


