One Profiler for All HPC Systems
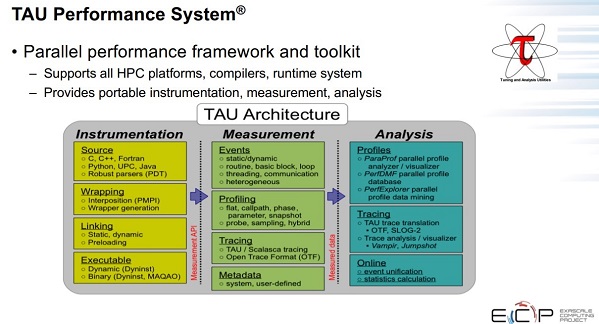
A brief summary of TAU’s capabilities is illustrated in Figure 1.
TAU also provides support for the instrumentation of Kokkos codes and a broad range of runtimes at the node level, including OpenMP, pthread, OpenACC, CUDA, OpenCL, and HIP. It supports detailed MPI-level data by using the PMPI and MPI Tools interface.[1]
Support for Lambda Functions
New software frameworks, such as Kokkos, have introduced performance portability and convenience features, such as lambda functions, to the HPC community. By using such languages and libraries, it is possible to write one version of a code that will run and produce correct results on many platforms. New abstractions, such as Intel’s OneAPI, are also in development to provide cross-platform applications that will run correctly on a variety of hardware platforms via a single code base.
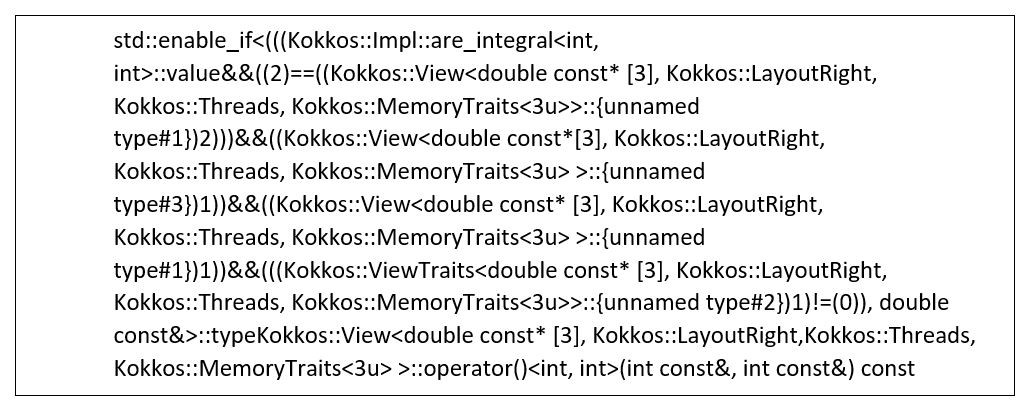
Figure 2: Example of a nested template instantiation. (Source: https://www.researchgate.net/publication/337720583_Multi-Level_Performance_Instrumentation_for_Kokkos_Applications_Using_TAU.)
The TAU team recognized that although cross-platform codes might run correctly, they might not perform equally well or adequately on all platforms. For this reason, they focused on a multilevel instrumentation strategy that encompasses the application code and language runtime to provide informative profiling information.[2]
Lambda functions excellently illustrate the need for informative profiling information. Many profilers use event-based profiling to evaluate complex nested template functions, such as the one shown in Figure 2.
Functions of this complexity are the result of the Kokkos infrastructure mapping the logical space to the physical memory layout at compile time via template programming.
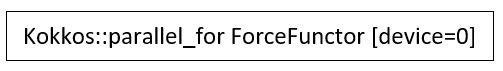
Figure 3: Example of how TAU can use callbacks to extract meaningful names from the Kokkos runtime. (Source: https://www.researchgate.net/publication/337720583_Multi-Level_Performance_Instrumentation_for_Kokkos_Applications_Using_TAU.)
To obtain insightful and actionable performance results, a performance tool must receive metadata from the runtime, providing data mapping runtime behavior back to the application code that produced it. TAU uses these callbacks to start and stop timers, allowing human-readable timer names to be used in place of the names of C++ template instantiations. Thus, users would see the profiler label as shown in Figure 3 rather than as the nested template instantiation shown in Figure 2.
Focus Optimization Efforts Based on Data
The TAU team gathers the raw profile information from many levels[3] to create several meaningful displays, reports, and trace analyzers that help users find performance issues in their parallel distributed codes. Shende notes, “With TAU, you can see the code regions of interest so you can study your application performance and identify where you should focus your optimization efforts.”
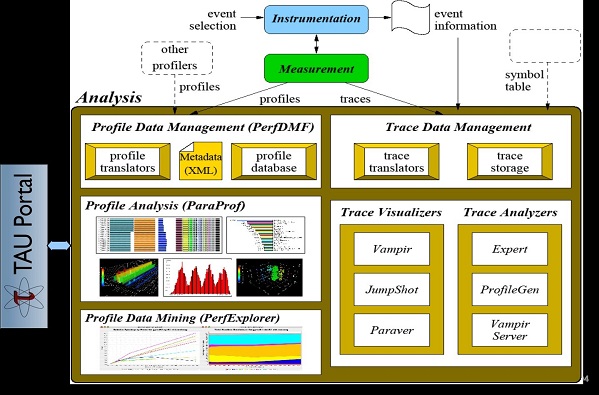
Figure 4. TAU Analysis with example ParaProf views.
Example views generated by the ParaProf analysis tool are shown in Figure 4. In particular, ParaProf can display profile information about MPI communication calls in addition to node- and thread-level displays. A standard in HPC, the MPI library handles the communications that dictate the scaling and performance of many HPC applications.
It is easy to find documents, success stories, video guides and tutorials that cover the extensive capabilities of the TAU Performance System.[4],[5],[6] It is also easy to install; Shende points out that, “TAU easily installs via Spack and is distributed in E4S. Just install TAU with the target backend CUDA, ROCm, L0 for OneAPI.”
Rob Farber is a global technology consultant and author with an extensive background in HPC and in developing machine learning technology that he applies at national laboratories and commercial organizations. Rob can be reached at info@techenablement.com


TAU article-. More reading to do, but Kudos to my old friend Rob Farber.