Sponsored Post
 Some applications are so inherently complicated that it is difficult to dig through the many layers of connected algorithms to expose the parts of the code ripe for optimization. This makes them a challenge to design and tune.
Intel® Threading Building Blocks (Intel® TBB) C++ template library provides an easy way for developers of complex applications, such as machine learning, to express parallelism on the latest multicore architectures and heterogeneous systems. In particular, the flow graph interface, which was introduced into Intel TBB 4.0 in 2011, helps to create scalable applications that exploit higher levels of parallelism in a much more manageable way.
Flow graphs represent computational tasks as nodes and the communication between them as edges. By specifying a dependency graph, the developer expresses all the inter-dependencies between executing nodes. This gives the Intel TBB scheduler the flexibility it needs to efficiently exploit the parallelism explicit in the data flow graph. Messages received by a node spawn Intel TBB tasks to execute the computational work in the body of that node.
The Intel TBB flow graph interface supports various types of nodes, including functional nodes that execute user code, nodes that order and buffer messages as they flow through the graph, nodes that join and split messages, and other special purpose nodes. Application developers connect these nodes together in the graph to specify the dependencies between them and the code to perform.
Some deep learning applications tend to have very complex graphs with thousands of nodes and edges. To make it easier to visualize, analyze, design, and tune such complex parallel applications employing Intel TBB flow graphs, Intel provides Intel Advisor Flow Graph Analyzer (Intel FGA).
Intel Flow Graph Analyzer helps developers create and tune flow graph applications:
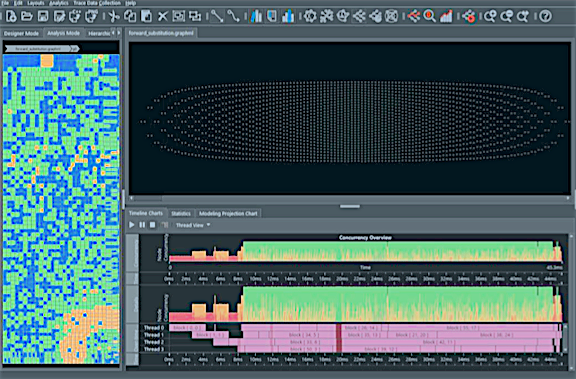
- As an analyzer, it has the capability to collect and visualize execution traces from Intel TBB flow graph applications. Here developers can explore the topology of their graphs, interact with a timeline of node executions, and view performance statistics projected on to the nodes of their graphs.
- As a designer, programmers can create Intel TBB flow graph diagrams visually and then generate C++ stubs as a starting point for further development.
Intel FGA offers the developer two views to assist in analyzing performance to identify where the majority of the time is spent in an application. This is usually the first step in performance optimization.
[clickToTweet tweet=”Intel Advisor FGA gives developers a comprehensive set of tools to examine, debug, and analyze Intel TBB flow graphs.” quote=”Intel Advisor Flow Graph Analyzer gives developers a comprehensive set of tools to examine, debug, and analyze Intel TBB flow graphs.”]Intel FGA provides a tree-map view that shows the total CPU time as a rectangle subdivided into smaller rectangles that each represent the nodes in the graph. The area of the rectangle is proportional to the CPU time consumed by the node, and gives the user an immediate visual impression of CPU utilization by the nodes.
A second view reveals the critical paths through the application and shows it on the flow graph’s topology. This view highlights the main set of nodes worth considering for optimization. Using both the tree map and the critical path views, it is now possible to determine which nodes on the application’s critical path are the most time consuming.
Once identified, the designer can further inspect the performance of critical nodes using the timeline and execution trace views in Intel Advisor FGA. Zooming in on a task related to the critical path reveals threads that are busy and threads that are idle. Idle tasks indicate opportunities for optimizing the body code of the node to run better in parallel.
Intel FGA gives developers a comprehensive set of tools to examine, debug, and analyze Intel TBB flow graphs. In addition to the timeline and flow graph topology views, Intel FGA can also show detailed statistics regarding overall and per node algorithm performance statistics to better determine the best regions for optimization.
Intel Advisor is part of Intel Parallel Studio XE 2018. / Get a free Download of Intel Parallel Studio XE 2018