
Could the reason your application is underperforming be due to the configuration of the platform you’re running on? But how would you know?
Turns out that the way a system is configured can raise significant issues affecting application performance. Maybe running on a different system with a different configuration could result in better performance?
To discover what’s going on you would need to perform in-depth, system-focused, long-term analysis to determine:
- How well is the system being utilized?
- Is the hardware under- or over-utilized?
- What is the headroom on the system?
- What are the imbalances?
- How does my application or workload behave on this system?
But even if you could get meaningful data to answer these questions, where would you start?
Most performance analysis tools collect a huge amount of data but rarely show performance metrics with the level of detail you need to make strategic decisions regarding system configurations affecting overall performance.
Intel® recently released a tool for doing this. The Intel VTune™ Amplifier Platform Profiler on Windows* and Linux* systems shows you critical data about the running platform that help identify common system configuration errors that may be causing performance issues and bottlenecks. Fixing these issues, or modifying the application to work around them, can greatly improve overall performance.
[click_to_tweet tweet=”Intel Platform Profiler could help you find out why your application is underperforming.” quote=”Intel Platform Profiler could help you find out why your application is underperforming.”]
Platform Profiler gives infrastructure architects, software designers, and quality assurance engineers detailed interactive configuration topology diagrams that help identify potential problems.
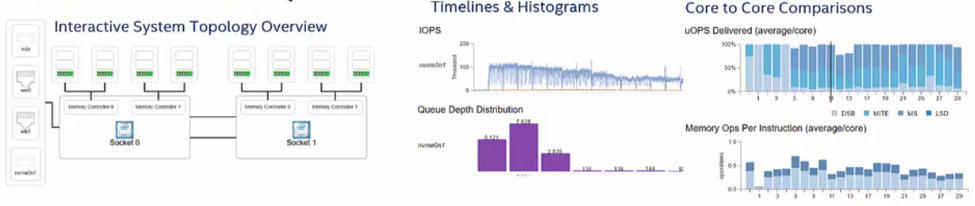
Also, the Platform Profiler displays various charts regarding system and application performance metrics that can be drilled down interactively to reveal great detail. Metrics include:
- Memory and CPU utilization
- Memory and socket interconnect bandwidth
- Cycles per instruction
- Cache miss rates
- Instructions executed
- I/O storage device accesses
These metrics can be collected over any number of minutes to hours by sampling OS and hardware performance counters, and made available in a RESTful API for later analysis by scripts.
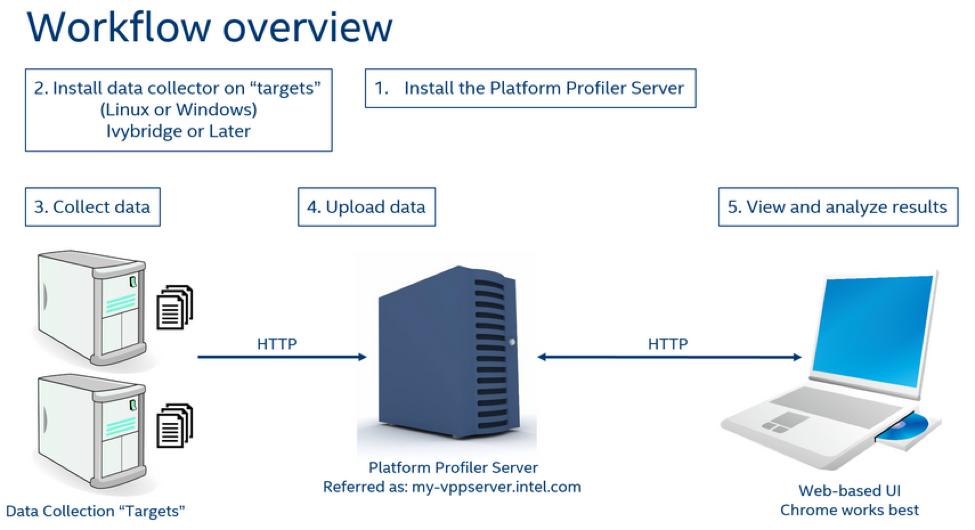
The Intel VTune Amplifier Platform Profiler has three main components. The Data Collector is a standalone package that is installed and run on the platforms to be profiled. It computes metrics based on data collected from system-level hardware and operating system performance counters, and stores the collected data in readable files.
The Platform Profiler Server post-processes the data received from the Data Collector into a time-series database correlated with system topology information. It serves data to various HTTP-based clients using a RESTful API.
Finally, a web-based user interface presents interactive system topology diagrams, graphs, and histograms annotated with the collected performance data that can be zoomed and panned over timeline events. Hovering over these charts and diagrams reveals a great amount of detail while annotations provide hints for locating the possible configuration issues causing performance bottlenecks.
What’s really interesting are the system performance metrics that software developers rarely get to see. These metrics can be collected on a number of platforms and configurations and compared to see how moving an application to another platform, or making strategic configuration changes affect performance. These metrics help answer questions about the behavior of:
- the overall system
- individual sockets
- core pipelines and private caches
- memory sub-system
- detached disks
- system interconnects and network traffic
The Platform Profiler presents an incredible level of detail that you can use to investigate processor utilization, processor frequency, cycles per instruction (a measure of efficiency), C-State residencies, and power (Watts), as well as operation mixes such as memory loads / stores and branch vs. floating point instructions. At the memory system level, you can follow memory consumption, L1 and L2 cache misses, and page faults. While for the interconnects, metrics include memory, socket, and I/O throughput and latency as well as Intel Ultra Path Interconnect (UPI) / QPI throughput, utilization, and sleep state.
Finally, device I/O, metrics collected include disk throughput, read and write block sizes, read and write response latencies, IOPS, and queue depth, which are presented in both a timeline and distribution format. And network profiles include send / receive throughput and Infiniband* Remote Direct Memory Access (RDMA).
This is the depth of detail you need to get the most out of the systems you rely on.
Intel VTune Amplifier Platform Profiler is part of Intel® Parallel Studio XE 2019 Professional and Cluster editions.
· Intel® VTune™ Amplifier – free trial copy (30 days)
· Intel® Parallel Studio 2019 – free trial copy (30 days)