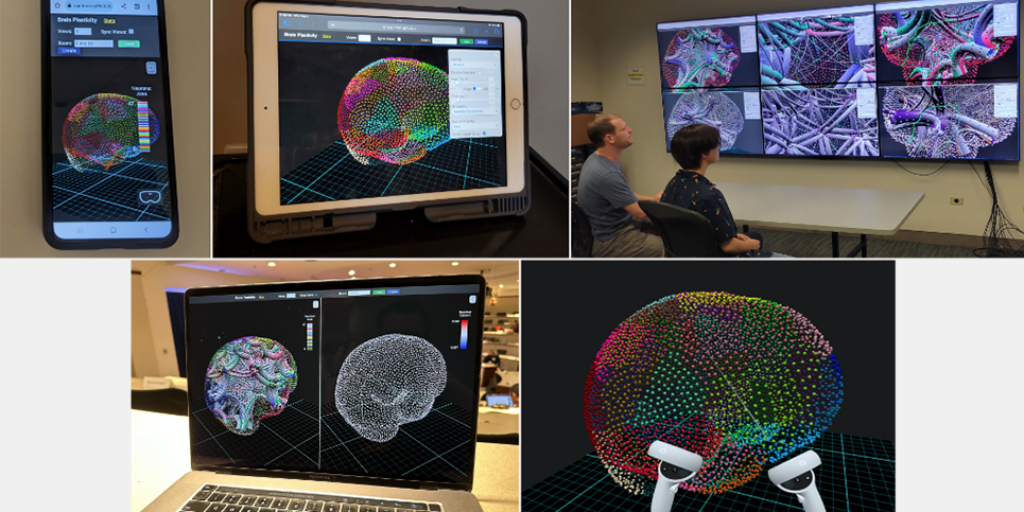
The team’s VisAnywhere application enables researchers to interact with brain plasticity visualizations across multiple display platforms.
Researchers from the Argonne Leadership Computing Facility (ALCF), the University of St. Thomas, and the University of Illinois Chicago (UIC) won first place and “best workflow” at the Institute of Electrical and Electronics Engineers’ (IEEE) 2023 SciVis Contest for their development of a multi-platform scientific visualization application for analyzing data from brain plasticity simulations.
Led by Tommy Marrinan, ALCF computer scientist and an associate professor at the University of St. Thomas, the team included ALCF computer scientist Victor Mateevitsi, ALCF director and UIC professor Michael Papka, and University of St. Thomas students Madeleine Moeller and Alina Kanayinkal. The ALCF is a U.S. Department of Energy (DOE) Office of Science user facility at DOE’s Argonne National Laboratory.
The SciVis Contest, which is held annually as part of the IEEE VIS Conference, challenged participants to develop novel visualization approaches that can help scientists better understand the changing structures within the human brain. The teams were given a dataset of neuronal network simulations of plasticity changes in the human brain to prepare their submissions. Representative of the large datasets routinely in use at the ALCF, Marrinan and colleagues’ work to develop a method for visualizing science on a variety of different display platforms will be useful to the entire ALCF user community.
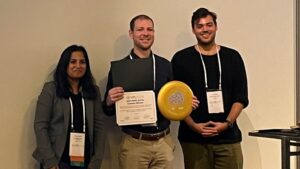
Tommy Marrinan (center) receives awards for first place and best workflow at the 2023 SciVis Contest.
The team’s winning entry, “VisAnywhere: Developing Multi-platform Scientific Visualization Applications,” demonstrated how a single codebase can be adapted to develop visualization applications that run on a variety of display technologies, including mobile devices, laptops, high-resolution display walls, and virtual reality headsets.
“To perform visualization tasks on different display devices, developers typically need to create separate applications that are specifically designed for each device,” Marrinan said. “Our goal was to develop an application and workflow to enable interactive visualizations that can be accessed anywhere from any device with an internet connection. With the ability to spread visualization and interaction across multiple devices simultaneously, our approach is conducive to both in-person and remote collaboration.”
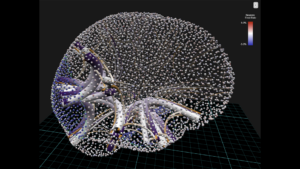
This visualization shows the difference in neuron fired rate and connections in a brain injury simulation just prior to and shortly after an injury occurred. Purple tubes are lost connections (connections that existed prior to the injury that are no longer present after the injury). Orange tube are newly formed connection (connections that did not exist prior to the injury that were formed to adapt to injury). Image: Tommy Marrinan, Argonne National Laboratory/University of St. Thomas; Michael Papka, Argonne National Laboratory/University of Illinois Chicago; Victor Mateevitsi, Argonne National Laboratory; Alina Kanayinkal and Madeleine Moeller, University of St. Thomas.
The team’s application workflow offers a combined framework for carrying out data preprocessing, three-dimensional scientific visualization, two-dimensional information visualization, and multi-device collaborative interaction.
To evaluate the application’s utility, the team worked with end users to get feedback on the prototype.
“They were able to interpret simulation data without needing an explanation of what was being visualized,” Marrinan said. “Both users found the application to be highly intuitive and expressed interest in incorporating our tool into their workflow. We plan to continue collaborating with them to improve the application’s capabilities for brain research.”