

Jeff Layton
Over at Admin HPC, Intel’s Jeff Layton writes that understanding how data makes its way from the application to storage devices is key to understanding how I/O works and that monitoring the lowest level of the I/O stack, the block driver, is a crucial part of this overall understanding of I/O patterns.
Linux comes with a couple of tools, blktrace and blkparse, for tracing activity at the block level; however, they can be difficult to use and require a little finesse. A nifty tool named ioprof uses these tools to produce a very useful report of I/O patterns at the block level that includes histograms, heat maps, and I/O size stats. You can run ioprof in a data gathering mode that collects data for later postprocessing, a “live” mode that lets you watch developments in real time, and a postprocessing mode that produces some really useful output. The ASCII IOPS heat map charts can be very useful for a quick evaluation of I/O behavior, and the PDF version of the report has some great charts.
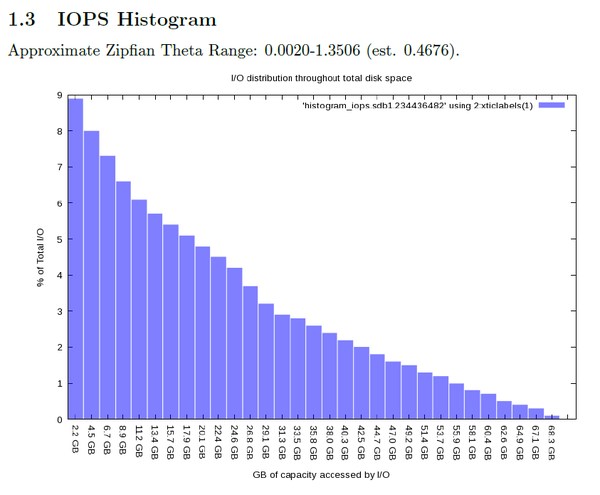
PDF IOPS histogram during IOzone write test
Read the Full Story.
Sign up for our insideHPC Newsletter.