Sponsored Post
 Memory and threading errors are very hard to find and correct just by looking at the code. Memory leaks, data corruption, illegal accesses, data races, deadlocks, and so on, are rarely detectable this way. Alternatively, running the program under the control of a debugger can reveal errors and vulnerabilities too complex to be found by static analysis alone.
Intel Inspector is an integrated debugger that can easily diagnose latent and intermittent errors and guide users to locate the root cause. It does this by instrumenting the binaries, including dynamically generated or linked libraries, even when the source code is not available. This includes C, C++, and legacy Fortran codes. You can use your normal debug or production code – recompilation is not necessary.
Because instrumenting code tends to add overhead, you can choose the scope of Intel Inspector’s analysis. For memory analysis, there are three levels, from narrowest scope (and lowest overhead) to widest scope (and highest overhead), to detect leaks, memory access problems, and to locate the causes. For threading analysis there are also three levels, to detect deadlocks, data races, diagnose causes. Wider scopes are capable of identifying more errors, but will take longer to run.
Intel Inspector’s analysis can be turned on and off around a section of code with a suspected problem. This is a good way to limit instrumentation overhead to just the code with errors.
Intel Inspector interfaces most full-featured debuggers (Visual Studio*, GDB*, IDB*) for setting breakpoints and examining variables to diagnose problems. Issues such as unusual memory/heap growth due to memory leaks can be displayed graphically while the program is running.[clickToTweet tweet=”Use Intel Inspector to diagnose memory leaks and threading errors.” quote=”Use Intel Inspector to diagnose memory leaks and threading errors. “]
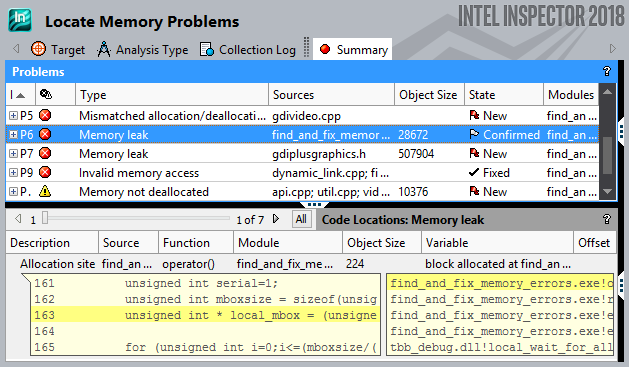
Intel Inspector can detect and diagnose various common memory and threading problems including:
- Cross-thread stack access – a thread accesses another thread’s stack.
- Data race – multiple threads access the same memory location without proper synchronization and at least one access is a write.
- Deadlock – two or more threads are waiting for each other to release resources while holding resources the other threads are trying to acquire.
- Invalid deallocation – an application calls a deallocation function with an address that does not correspond to dynamically allocated memory.
- Invalid memory access – a read or write instruction references memory that is logically or physically invalid, or when a read or write instruction references a block of memory where part of the block is logically invalid.
- Lock hierarchy violation – the acquisition order of multiple synchronization objects in one thread differs from the acquisition order in another thread.
- Memory growth/leak – a block of memory is allocated but not deallocated within a specific time segment during application execution, or when a block of memory is allocated, never deallocated, and no longer reachable.
- Memory not deallocated – a block of memory is allocated, never deallocated, but still reachable at application exit
- Missing or mismatched allocation/deallocation – an invalid pointer is passed to a deallocation function, or a deallocation is attempted with a function that is not the logical reflection of the allocator that created it.
- Unhandled exception – the application crashes because of an unhandled exception thrown by the application.
- Uninitialized memory access – a read of an uninitialized memory location or block of memory where part of the block is uninitialized.
Intel® Inspector is available as part of Intel® Parallel Studio XE 2018.