Intel Inspector is an integrated debugger that can easily diagnose latent and intermittent errors and guide users to locate the root cause. It does this by instrumenting the binaries, including dynamically generated or linked libraries, even when the source code is not available. This includes C, C++, and legacy Fortran codes.
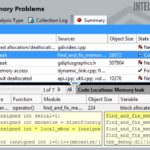
Use Intel® Inspector to Diagnose Hidden Memory and Threading Errors in Parallel Code
December 28, 2017 by