This sponsored post from Intel explores ways to find and eliminate memory bottlenecks that could be limiting your applications’ performance.
Often, it’s not enough to parallelize and vectorize an application to get the best performance. You also need to take a deep dive into how the application is accessing memory to find and eliminate bottlenecks in the code that could ultimately be limiting performance. So how do you do that?

Often, developers are not aware of memory access patterns in their code that are inhibiting best performance (Photo: Shutterstock/by 3dkombinat).
Often, developers are not aware of memory access patterns in their code that are inhibiting best performance in general, or specifically on the platform the code is running on. Is the code utilizing the high-performance features that the latest systems provide, or is it leaving a lot of potential performance gains on the table? How would you know?
That’s where the analyses provided by Intel Advisor, a component of both Intel Parallel Studio XE and Intel System Studio, can help you identify and diagnose memory performance issues, and suggest strategies to improve the efficiency of your code.
What are some of the performance issues Intel Advisor can help identify?
- Are There Bad Memory Access Patterns? Loops that access memory non-sequentially cause the most latency and bandwidth problems due to cache misses. To get new data, new cache lines from memory evict current cache lines, potentially resulting in cache thrashing and a big negative impact on performance.
- Are There Too Many Branches? Conditional branches within loops are compiled using mask registers so that the loop can be vectorized. But it can lead to very inefficient memory utilization.
- Is a Loop Memory or CPU Bound? Memory bound loops execute too many memory instructions, while CPU bound loops execute too many scalar compute instructions. What you want are vector instructions wherever possible. This is especially true on the latest platforms with Intel AVX-512 vector instruction sets.
Intel Advisor presents this information to you in summary reports. But you can also dive deeper.
For example, there’s Roofline Analysis, which offers a visual representation of application performance, relating it to limitations, such as memory bandwidth and computational peaks, specific to the platform the code is running on.
Intel Advisor automatically builds Roofline plots that give you insights into:
- Where your performance bottlenecks are
- How much performance is left on the table because of them
- Which bottlenecks are possible to address, and which are worth addressing
- Why these bottlenecks are most likely occurring
- What your next steps should be
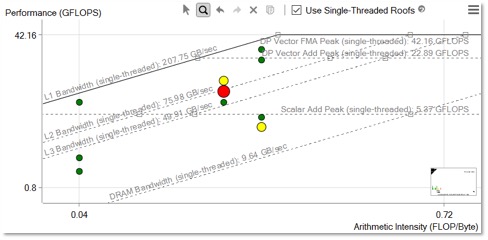
Here is a typical Roofline plot. (Image: Courtesy of Intel)
Horizontal lines in the Roofline plot represent the number of floating-point or integer computations of a given type your hardware can perform in a given span of time. The diagonal lines represent how many bytes of data a given memory subsystem can deliver per second. Each dot is a loop or function in your program. Its position indicates its performance.
Digging deeper, Roofline analysis can also reveal where bottlenecks come from. Intel Advisor counts the data transfers between cache levels and evaluates the arithmetic intensity (FLOP per byte) for each loop and memory level. This makes it possible to compare actual memory traffic against the best possible bandwidths estimates for the hardware the program is running on. Intel Advisor can then identify specific memory bottlenecks and suggest strategies for optimization.
Intel Advisor also provides Memory Access Pattern (MAP) analysis for an even deeper view of how memory access patterns in your code affect the efficiency of vectorization, giving insight into how much memory bandwidth you could possibly achieve. By collecting data regarding memory accesses during execution of specified loops in the program, MAP analysis can identify the individual instructions accessing memory. A MAP report shows what types of strides were observed by the memory operations in those loops, and relate them back to the actual source code.
With Roofline analysis, you can visualize your memory bottlenecks, and get even greater insights by combining Roofline with Intel Advisor’s unique Memory Access Pattern and Memory Footprint analyses.
Another report from Intel Advisor, Memory Footprint, reveals the range of memory for given loop accesses. Large ranges might not be able to fit in cache memory, causing bandwidth and latency issues due to cache misses. Here is where various optimization strategies such as cache blocking can greatly improve overall performance.
Two important metrics reported give you a basic idea of your program’s memory footprint:
- Max Per-Instruction Address Range measures the maximum distance between minimum and maximum memory addresses accessed in loops.
- First Instance Site Footprint gives a more precise measure of the memory footprint, since it’s aware of overlaps and gaps in address ranges in the loop iterations, but is calculated only for the first instance (call) of a loop.
An even more advanced footprint measurement, the Simulated Memory Footprint, is based on a simulation of cache activity. This metric gives a summarized and overlap-aware picture across all loop instances in a single thread. It is calculated as the number of unique cache lines accessed during cache simulation multiplied by cache line size.
The Intel Advisor Refinement Report gives a detailed view of these cache-related metrics: the total number of memory loads, stores, cache misses, and cache-simulated memory footprint. This makes a more detailed study of loop behavior with respect to memory possible.
Clearly, optimizing how your program accesses memory is crucial to getting the best performance out of the latest hardware. Using a tool like Intel Advisor can help you understand where the bottlenecks are and what you can do about them. With Roofline analysis, you can visualize your memory bottlenecks, and get even greater insights by combining Roofline with Intel Advisor’s unique Memory Access Pattern and Memory Footprint analyses.
You can now download Intel Advisor as a FREE standalone product here.