Sponsored Post
 Tuning a complex application for today’s heterogeneous platforms requires an understanding of the application itself as well as familiarity with tools that are available for assisting with analyzing where in the code itself to look for bottlenecks. The process for optimizing the performance of an application, in general, requires the following steps that are most likely applicable for a wide range of applications.
- What loops should be threaded and vectorized first?
- Is the performance gain worth the effort?
- Will the threading performance scale with higher core counts?
- Does this loop have a dependency that prevents vectorization?
- What are the trip counts and memory access patterns?
- Have you vectorized efficiently with the latest Intel® Advanced Vector Extensions 512 (Intel® AVX-512) instructions? Or are you using older SIMD instructions?
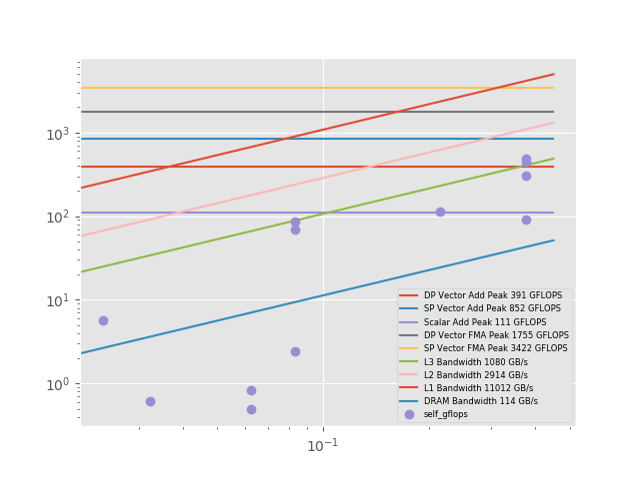
While Intel may be well known for developing the most advanced microprocessors and accelerators in the world today, Intel also provides advanced tools that assist a developer in optimizing software for the underlying hardware. A comprehensive suite of tools are available that help the developer to answer the questions above and should be part of an overall effort to modernize applications for todays computing environments. A lot of statistics and metrics can be obtained of how an application is performing. However, understanding all of this information can be quite overwhelming. Now, there is a powerful new tool available from Intel, that allows reports of the performance of an application be generated using a Pyton interface.
When you run Intel Advisor, it stores all the data it collects in a proprietary database that you can now access using a Python API. This provides a flexible way to generate customized reports on program metrics. This article will describe how to use this new functionality.
For example a Python script could easily be created that compares the vectorization of a given loop when compiled with different compiler options. The first step would be to compile the application with different flags, such as –O and –O3. Then write and execute a Python script that uses the options available. The results from the Python script will show where the application could most benefit from further vectorization, as well as the performance gain.
[clickToTweet tweet=”Use the Intel® Advisor Python* API to gain more insight into your HPC application.” quote=”Want easier reports on how to optimize your HPC application?”]On modern processors, including Intel Xeon CPUs and Intel Xeon Phi processors,, it’s crucial to both vectorize and thread software to realize the full performance potential of the processor. The new Intel Advisor Python API in Intel Parallel Studio XE provides a powerful way to generate program statistics and reports that can help you get the most performance out of your system. Based on your specific needs, you can tailor and extend examples that are found in the documentation. Intel is actively gathering feedback on the Intel Advisor Python API.
By simplifying the process to understand how High Performance Computing application interact with the underlying hardware, tremendous advances can be achieved as part of a modernization code project. Look for easy to use and powerful tools that can report back to the developer on the various choices for compilers that are made.


