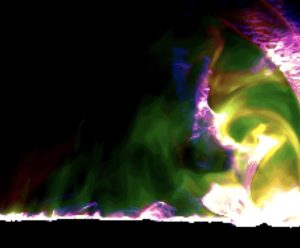
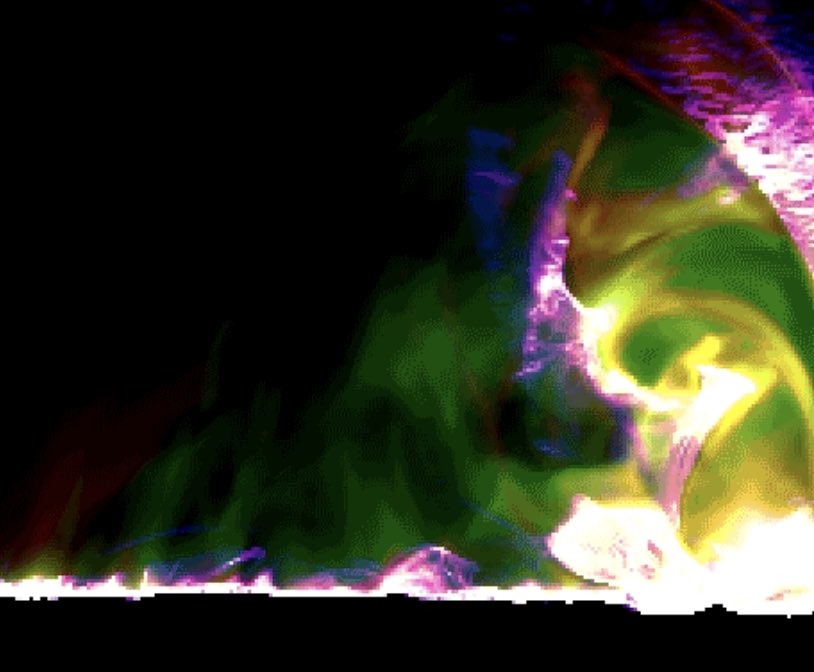
 In this video, scientists from NCAR and Lockheed Martin simulate the formation of a solar flare, including for the first time the spectrum of light emissions known to be associated with such flares.
This work allows us to provide an explanation for why flares look like the way they do, not just at a single wavelength, but in visible wavelengths, in ultraviolet and extreme ultraviolet wavelengths, and in X-rays,” said Mark Cheung, a staff physicist at Lockheed Martin Solar and Astrophysics Laboratory and a visiting scholar at Stanford University. “We are explaining the many colors of solar flares.”
A team of scientists has, for the first time, used a single, cohesive computer model to simulate the entire life cycle of a solar flare: from the buildup of energy thousands of kilometers below the solar surface, to the emergence of tangled magnetic field lines, to the explosive release of energy in a brilliant flash.
Solar and stellar flares are the most intense emitters of X-rays and extreme ultraviolet radiation in planetary systems1,2. On the Sun, strong flares are usually found in newly emerging sunspot regions3. The emergence of these magnetic sunspot groups leads to the accumulation of magnetic energy in the corona. When the magnetic field undergoes abrupt relaxation, the energy released powers coronal mass ejections as well as heating plasma to temperatures beyond tens of millions of kelvins. While recent work has shed light on how magnetic energy and twist accumulate in the corona4 and on how three-dimensional magnetic reconnection allows for rapid energy release5,6, a self-consistent model capturing how such magnetic changes translate into observable diagnostics has remained elusive. Here, we present a comprehensive radiative magnetohydrodynamics simulation of a solar flare capturing the process from emergence to eruption. The simulation has sufficient realism for the synthesis of remote sensing measurements to compare with observations at visible, ultraviolet and X-ray wavelengths. This unifying model allows us to explain a number of well-known features of solar flares7, including the time profile of the X-ray flux during flares, origin and temporal evolution of chromospheric evaporation and condensation, and sweeping of flare ribbons in the lower atmosphere. Furthermore, the model reproduces the apparent non-thermal shape of coronal X-ray spectra, which is the result of the superposition of multi-component super-hot plasmas8 up to and beyond 100 million K.
Read the Full Storry in Nature Astronomy.


