 A software toolkit developed at Berkeley Lab to better understand supercomputer performance is now being used to boost application performance for researchers running codes at NERSC and other supercomputing facilities.
This work, spearheaded by computer scientists in Berkeley Lab’s Computational Research Division (CRD), is helping to address the growing gap between processor performance and memory performance—the “memory wall”—that can limit how well many scientific applications perform. Even with the fastest processors, if data gets bogged down moving in and out of memory, the processors end up waiting for data to process, which slows overall performance.
With the popularity of manycore processors—such as the Intel Knights Landing processors in Cori, NERSC’s new 30-petaflop system—and the diversity of computing architectures, supercomputers are increasingly complex, making it difficult for users to achieve sustained application performance across different architectures. But understanding memory bandwidth limits can help explain the gap between theoretical and observed performance. Thus performance models and tools that aid users’ understanding of bandwidth limits for a particular application are crucial.
Visualizing Performance Potential
Toward this end, in 2005 Sam Williams—then a Ph.D. student at the University of California, Berkeley and now a staff scientist in CRD’s Performance Algorithms Research Group —began sketching out a model that could estimate performance on a variety of kernels common to high performance computing.
“As the HPC community transitioned from single-core to multicore architectures, it became clear we needed some means of visualizing the performance potential of various HPC kernels on the zoo of emerging manycore architectures,” Williams said, “At the time there was a great deal of buzz around IBM’s forthcoming Cell processor and interest in quantifying its performance on HPC codes. Unfortunately, as neither hardware nor simulators were yet available, we could not directly run benchmarks on the platform.”

Samuel Williams
Williams’ initial model, which used bound and bottleneck analysis, was applied to the Cell processor, and in 2006 the performance results were published in a UC Berkeley Tech Report and in a well-received Computing Frontiers paper. He then began working to visualize the performance bottlenecks. After several iterations, the resulting model—dubbed “Roofline” by David Patterson, William’s thesis advisor at UC Berkeley—was published in Communications of the ACM in 2009.
A Team Effort
The Roofline Model is designed to enable users to assess the quality of attained performance of an application by combining data locality (how much data needs to move in and out of the processor), bandwidth (the speed at which that data can be moved) and different parallelization paradigms into a single performance figure, yielding a two-dimensional graph that clearly plots the bandwidth bottlenecks that must be eliminated to speed up the application.
The idea of Roofline is two-fold,” said Lenny Oliker, a computer senior scientist in CRD’s Performance Algorithms Research Group who has worked closely with Williams to refine and expand Roofline’s capabilities. “First, we need to understand the underlying hardware architecture (of the supercomputer), its capabilities and the performance of real codes running on it. Then we want to characterize actual applications and graph them onto the Roofline chart.”
 In practice, the Roofline model is a graph with an x and y axis where the x axis is the arithmetic intensity—a measure of flops per byte, explained Jack Deslippe, acting group lead for NERSC’s Application Performance Group who is working with Williams and other Berkeley Lab colleagues to extend the model and its applications. “In computer code what this means is how many floating point operations (FLOPs) do you do for every byte of data that you have to bring in from memory,” Deslippe said. “What the Roofline curve tells you is what performance you can expect from the system given the characteristics of your application or a subroutine of the application.”
In the Roofline Model, the starting point for assessing performance is the peak computation rate, which is represented by a horizontal line showing the highest possible performance and resembles the top roofline of a building. The sloped part of the roof is determined by peak bandwidth between the memory where the data is stored and the processor where it is used to perform operations. The third pieces of the Rrofline structure are the upright, vertical “posts” indicating the arithmetic intensity—the ratio of the number of flops performed to the total number of bytes of data moved. The higher this ratio, the better the overall performance of the application.
Since its initial development, what is now known as the Empirical Roofline Toolkit (ERT) has benefitted from contributions by several Berkeley Lab staff. In 2013, CRD’s Terry Ligocki developed a benchmark that could automatically characterize CPU and GPU architectures; this became the ERT. And in 2015 NERSC’s Matt Cordery created the toolkit’s initial instrumentation technology. Along the way, HPC users who write scientific applications for manycore systems have been able to apply the toolkit to their applications and see how changing parameters of their code can improve performance.
Extending Functionality
While the Roofline model has been used for a number of years to characterize supercomputing systems and architectures, over the past year it has been expanded to both visualize and guide application optimization, and new tools have been developed to support this, according to Deslippe. As part of this effort, NERSC’s Doug Doerfler has extended and applied the technology to the Knights Landing processors in the Cori KNL system.
We are using this model to frame the conversation with users about where their application stands,” Deslippe said. “It’s a good way to communicate with users about what they need to work on with a given application or subroutine. It takes a little of the mystery out of code optimization.”
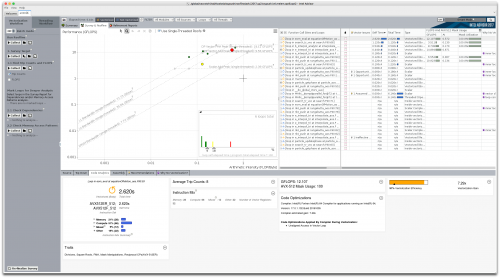
In addition, through a collaboration with Intel, the Roofline team has been working to incorporate Roofline into Intel’s Vector Advisor Tool, a vectorization optimization and shared memory threading assistance tool. The resulting Intel Advisor Roofline Tool allows users to collect Roofline performance data, including accurate FLOPs counts that correctly consider different vector registers and masks using Intel’s PIN tool, as well as accurate data traffic from various levels of the cache memory hierarchy. By determining the total number of FLOPs that will be performed and the amount of data that will be moved, plus the amount of time it will take to complete the job, users can plot the performance of their code on the Roofline graph. They can then use this plot to see how adjustments to how the code is set up can increase the performance.
In the past we were using Roofline to characterize the HPC systems themselves,” said Deslippe. “In the last year, we have gone to using Roofline not just for this but as a way to guide the optimization process for applications. There are all these new, novel parts of the Intel Knights Landing (KNL) hardware—very fast memory right on the chip, bigger vector units, manycores…—and they all sound impressive to the user, but how do they know which one is important for their application? This is where Roofline comes in.”
Roofline Use Case: XGC1 code
Over the past year, the Roofline team has been introducing NERSC users, including those involved in the NERSC Exascale Science Applications Program (NESAP), to the Roofline model to help them gauge performance improvements. For example, Tuomas Koskela, a NERSC postdoc who joined the center in 2016 to work on XGC1 (a fusion particle-in-cell code) as part of a NESAP project, has been using Roofline to improve the code’s performance on Cori.
We started talking about using Roofline last spring,” Koskela said. “It was interesting to me because I had a problem with my code that we didn’t understand why it wasn’t getting very good performance.” After using Roofline via Intel Advisor to optimize the performance of kernels of the XGC1 code for the KNL architecture, Koskela was able to dramatically improve the code’s performance on Cori.
“This demonstrates an effective optimization strategy that has enabled this science application to achieve up to 4.6x speed-up and prepare it for future exascale architectures,” Koskela said. “The Roofline model is a powerful tool for analyzing the performance of applications with respect to the theoretical peak achievable on a given computer architecture.”
Source: NERSC


