Sponsored Post
 As with all new technology, developers will have to create processes in order to modernize applications to take advantage of any new feature. Rather than randomly trying to improve the performance of an application, it is wise to be very familiar with the application and use available tools to understand bottlenecks and look for areas of improvement. Algorithm design is the overall leading candidate for gaining performance with new generations of processors such as the Intel Xeon Phi processor. While some performance can be gained using a methodology that will be described below, a poor design of the application probably cannot be overcome any magic that a skilled developer may be able to apply to the code.
[clickToTweet tweet=”Learn how to improve the performance of your HPC applications in six easy steps” quote=”Six Steps Towards Better HPC Performance”]
The first step is to measure the performance of the application with no tuning or analysis. The could be referred to as the baseline performance and then can be used to compare the performance with more optimized versions. An important note is to use what might be called a release build, as compared to a build of the application that would be used for debugging the application. A debug build would not contain any optimizations that would benefit production runs. Also, this build can be used to compare the results to later versions to determine if optimizations used later on affect the results.
Determining the hotspots in an application is crucial to the developer in looking at where to apply developer time to increase performance. Typically, loops will consume a disproportionate amount of time in an HPC application. Certain subroutines may be poorly coded or are trying to access memory in random locations. Using the Intel VTune™ Amplifier and Intel Advisor, the most time consuming functions can be determine. Then, a developer can focus on those portions of the application. Note that once a section of the code is optimized in some sense, other areas of the code may then show up as taking more time.
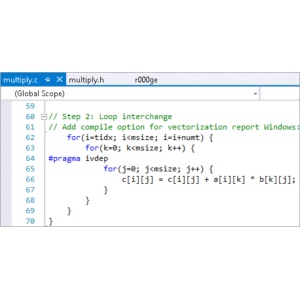
Vectorization is one of the most important techniques to gain significant performance. Using optimization reports that are produced by the compilers, the developer can determine if a certain loop was vectorized. Combined with the previous tip, look for hotspots that were not vectorized and determine what can be done to overcome this. Some areas of an application within a loop that might not vectorize would include dependence on previous calculations or random walks through data. If calculations are being performed on arrays, look into how those calculations can be vectorized. Vectorization is one of the top priorities that should be investigated to take advantage of modern processors.
The Intel Advisor can alert the developer to areas in an application that would benefit most from vectorization. Use the advice to dig deeper into various loops that are candidates for vectorization.
Use the recommended changes to loops in order to be candidates for vectorization. It is very important to understand that the results after changing may be different than the baseline version (one of the reasons to have run it and saved the results from a number of tests before starting this performance improvement task). A quick thought process for the developer is to look at the loop and determine of the results would be the same if the loop was run backwards. This will help to understand if there are any dependencies in the loop that need to be removed before vectorization can take place.
And finally, repeat the process. As mentioned before, if an area of the code is optimized that was a hotspot then that portion of the application may no longer show up as a hotspot, some other area will. Thus, this can go on for a long time. At some point, based on developer knowledge the iterative process of performance tuning will have to be declared over.
Download your free 30-day trial of Intel® Parallel Studio XE


